Practice: Using Performance and Protocol Logs and Managing Mailbox Limits
In this practice, you
configure the Performance Logs And Alerts tool to create a performance
log for trend analysis and to generate a report when an Exchange counter
exceeds a predefined value. You also check the SMTP protocol log for
problems and check for oversized mailboxes.
Exercise 1: Configure a Performance Log
In this exercise, you
configure a performance log by adding the counters that you want to
monitor and by specifying a sample time. For the purposes of this
exercise, a five second sample period is specified. If you wanted to log
activity over a long period of time, you would specify a larger sample
period, because otherwise the performance log file could grow to an
excessive size.
To configure a performance log, perform the following steps:
1. | On Server01, from the Start menu, click Administrative Tools, and then select Performance.
| 2. | In the console tree, expand Performance Logs And Alerts.
| 3. | Right-click Counter Logs, and then click New Log Settings.
| 4. | In the New Log Settings Name box, type MyLog and then click OK.
| 5. | On the General tab of the MyLog dialog box, check that the current log file name is the default, C:\PerfLogs\MyLog_000001.blg.
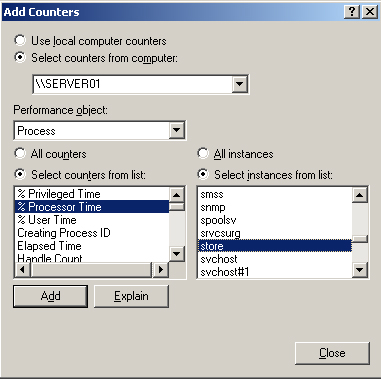
| 6. | Click Add Counters. In the Add Counters dialog box, select Use Local Computer Counters.
| 7. | In the Performance Object drop-down menu, select Processor.
| 8. | Choose the Select Counters From List option. In the scroll box below this option, select %Processor Time.
| 9. | Choose the Select Instances From List option and select _Total.
| 10. | Click Explain to obtain a description of this counter, and then click Add.
| 11. | Use the same technique to add the Process(store)\% Processor Time counter. Figure 1 shows this counter being added.
| 12. | Add the MSExchangeIS\RPC Requests and the MSExchangeIS\RPC Operations/sec counters.
| 13. | Add
the MSExchangelS Mailbox\Local delivery rate, the MSExchangelS
Mailbox\Folder opens/sec, and the MSExchangeIS Mailbox\Message opens/sec
counters.
| 14. | Add the PhysicalDisk(_Total)\Disk Transfers/sec counter.
| 15. | Add the Memory\Pages/sec counter.
| 16. | Add the SMTP Server\(_Total)Local Queue Length and the SMTP Server\(_Total)Messages Delivered/sec counters.
| 17. | | 18. | On the General tab of the MyLog dialog box, set the Sample Interval to 5 seconds.
| 19. | Click OK. If you are prompted to create the C:\Perflogs folder, click Yes.
| 20. | On
the Performance console, click Counter Logs and check that the MyLog
counter log is running. It should be green in color, and if you
right-click it, Start should be dimmed.
| 21. | On Server02, use OWA to send an e-mail to [email protected], with copies to [email protected] and [email protected].
| 22. | On Server01, use Outlook 2003 to send an e-mail to [email protected], with copies to Don Hall and Sean Alexander.
| 23. | On
Server01, create a C:\Temporary folder. Copy the contents of
C:\Windows\Drivers into that folder, delete the C:\Temporary folder, and
empty the Recycle bin.
Note Steps
21, 22, and 23 are designed to generate entries in the performance
counters being monitored. Any other activities that you want to test are
equally valid. |
| 24. | In Performance Logs And Alerts on Server01, right-click the MyLog log file, and then click Stop.
|
Exercise 2: Generate a Performance Report
To read the MyLog log file and generate a report, perform the following steps:
1. | On Server01, from the Start menu, click Administrative Tools, and then select Performance.
| 2. | In the console tree, click System Monitor.
| 3. | In the details pane, on the toolbar, click View Log Data.
| 4. | In the System Monitor Properties dialog box, access the Source tab, click Log Files, and then click Add.
| 5. | In the Select Log File dialog box, browse to C:\Perflogs in the Look In box (unless already selected).
| 6. | Click the MyLog_000001.blg log file, and then click Open.
| 7. | In the System Monitor Properties dialog box, select the Data tab, and then click Add.
| 8. | In the Add Counters dialog box, add all the counters for all the available performance objects, and then click Close.
| 9. | Click OK to close the System Monitor Properties dialog box.
| 10. | Use the toolbar to view the data in graph, histogram, and report format. Figure 2 shows report format.
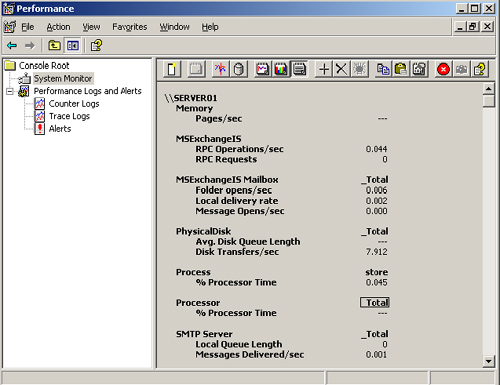
| 11. | Examine the data that you collected to determine whether any performance problems exist that you should act on.
|
Exercise 3: Read the Default SMTP Protocol Log File
In this exercise, you look at a specific log file. This exercise assumes
that you have enabled logging in your SMTP virtual server and that,
therefore, the SMTPSVC1 folder exists. If that is not the case, use
Exchange System Manager to navigate to the Default SMTP virtual server
Properties dialog box, enable protocol logging, and then send an e-mail
message to [email protected].
On Server01, from the Start menu, click Run, type C:\Windows\System32\Log-Files\SMTPSVC1, and then click OK. In the C:\Windows\System32\Logfiles\SMTPSVCl window, open any log file. If the W3SVC1 folder exists, read any log files in that folder. Some log files can hold a lot of information.
Exercise 4: Create a Mailbox Store Policy and a Recipient Policy, and Check for Oversized Mailboxes
In
this exercise, you check for oversized mailboxes. In order to do so,
you must first create and apply a mailbox store policy and a recipient
policy.
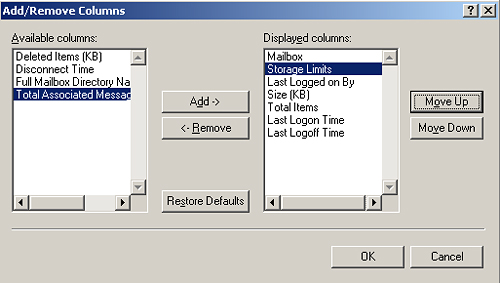
Start Exchange System Manager. Navigate
to Administrative Groups\First Administrative Group\Servers\Server01
\First Storage Group\Mailbox Store (SERVER01)\Mailboxes. Click Mailboxes. On the View menu, click Add/Remove Columns. In the Add/Remove Columns dialog box, in the Available Columns box, click Storage Limits, and then click Add. In the Displayed Columns box, click Move Up until Storage Limits is the second item in the list, as shown in Figure 3, and then click OK.
In
the Mailboxes details pane in Exchange System Manager, view the Storage
Limits column to determine whether any mailboxes are over their limit. Tip Click
the Storage Limits column header to sort the data by storage limit
status. This lets you locate large mailboxes more easily. |
To
delete items from an over-large mailbox, in Exchange System Manager,
navigate to Administrative Groups\First Administrative
Group\Servers\Server01, right-click Server01, and then click Start
Mailbox Management Process. Mailbox Manager deletes items based on the
recipient policy configured for your user mailboxes.
|